GregsBudget
- One low price - No subscription fees, in-app purchaes, ads, or tracking
- Multiple profiles - Create a profile for yourself and for anyone else that uses your computer
- Bill tracking - The report page tells you what bill is coming up due (never be late on a bill)
- Simple payments - Mark bills paid as you pay them (just check it off on the report)
- Budgeting - Set goals for spending in different categories and check your progress
- Record keeping - Keeps a record of every transaction in any account you choose
- Tax planning - Automatically sets aside money for taxes when drawing on tax deferred accounts
- Budget forecasting - See where you will be years into the future
- Wealth tracking - See your current or future net worth at a glance
- Retirement planning - Check how your retirement plans are going
- Smart transfers - Automatic calculation of required withdrawals for future expenses
- Reminders - Set reminders for anything
- What-if - Change dates, amounts, and events with a click of the mouse and see how the budget is affected
GregsBudget for Windows
Report Page
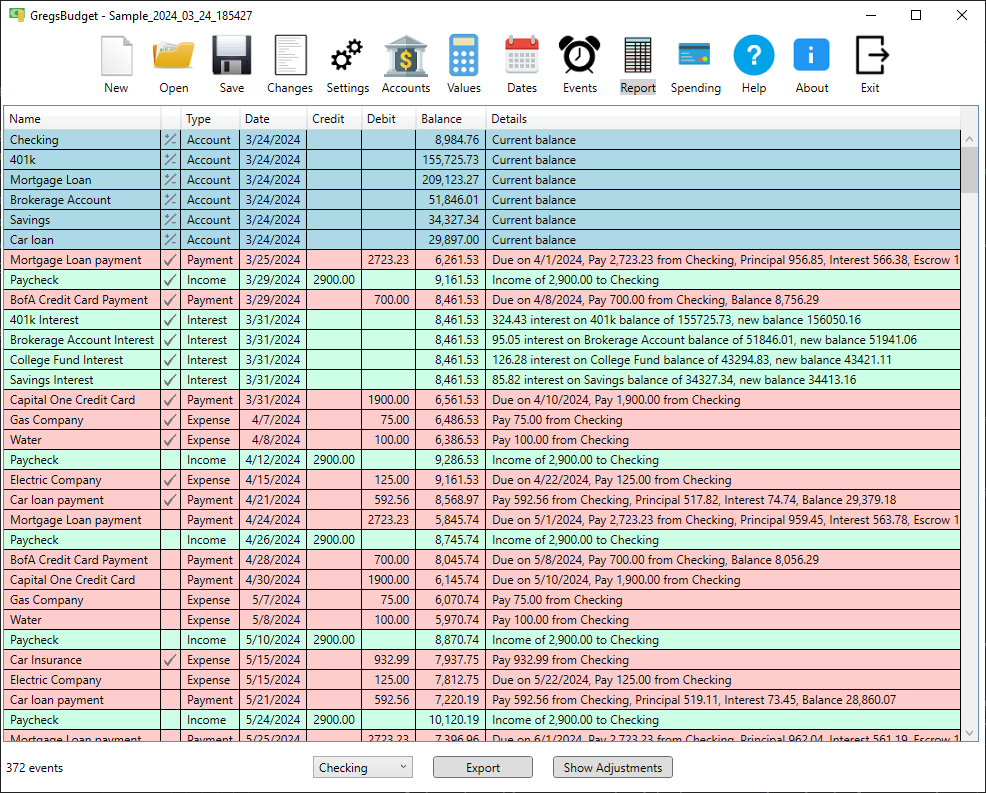
Report page
The report page is the default page that comes up when a budget file is loaded. This is where you can see what bills or other events are coming up and mark them complete as they are handled. It is also where you can see your account balance projected into the future based on the events you have entered. At the top of the report page is a list of accounts and current balances.
Here are some of the things you can do on the report page:
- Select any account to be shown in the report (showing Checking in the example above)
- By selecting a loan account you can see an amortization table for that loan
- See when upcoming bills are due and when you have them scheduled for payment
- Click a check mark to pay a bill or complete an event
- Double click on an upcoming bill or other event to modify that instance
- Click the "Show Adjustments" button to open the adjustment window and explore the "What-If" feature
- Export the report to CSV or text
Report Page (Adjustments)
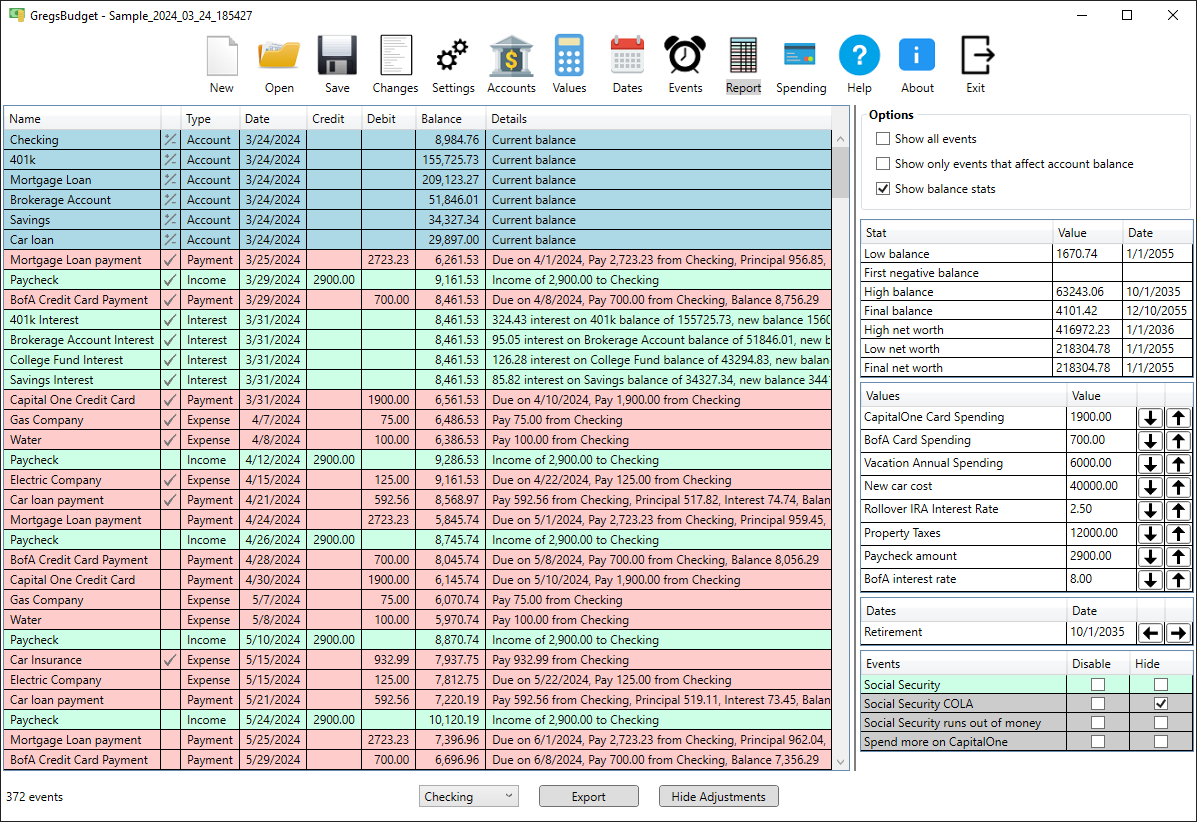
Report page (Adjustments)
The report page is also where the "What-If"or "Adjustments" feature is located. Just click the "Show Adjustments" button to open the adjustment panel on the right side of the report page. This is where date and values that have been marked as adjustable can be adjusted by just clicking the arrows. The effect on the balances as these dates or values are changed is immediately shown on the report. There are also some options shown at the top of the adjustment panel. Check "Show balance stats" to see changes in the account balance or net worth minimum and maximum as adjustments are made.
Accounts Page
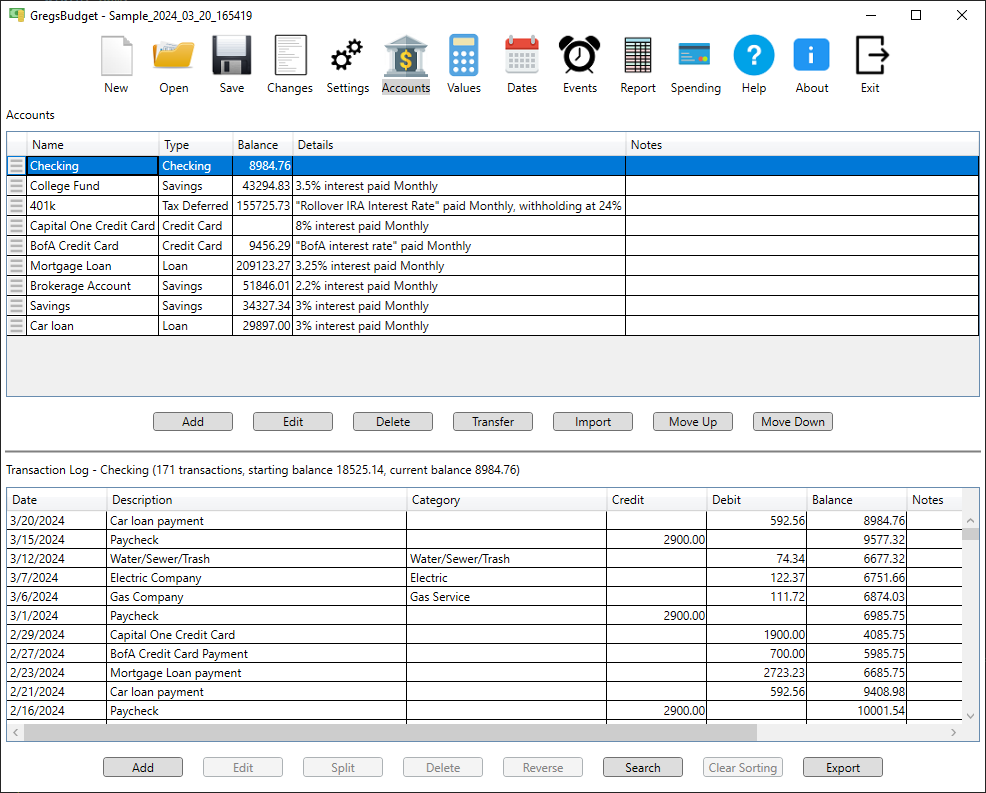
Accounts page
The accounts page shows the accounts in the upper half and transactions for the selected account in the lower half. It allows various operations to be performed on accounts or transactions. The three horizontal lines on the left of each account allows for dragging and dropping the accounts to reorder the list. The "Move Up" or "Move Down" buttons can also be used to move the selected account(s). Both the accounts and transactions can be temporarily reordered by clicking on the column header.
Here are some of the other things you can do with the accounts in the upper section:
- Accounts can be cash, checking, savings, tax deferred, loan, credit card or credit account
- Select any account to show transactions for that account
- Add, edit or delete an account
- Specify a currency for the account
- Automatically create interest events for interest bearing accounts
- Transfer funds from one account to another with the "Transfer" button
- Import CSV data into the selected account with the "Import" button
Here are some of the other things you can do with the transactions in the lower section:
- Add, edit, split, delete or reverse a transaction
- Search for transactions by description, date, amount, category and more with the "Search" button
- Export transactions to a CSV file using the "Export" button
Events Page
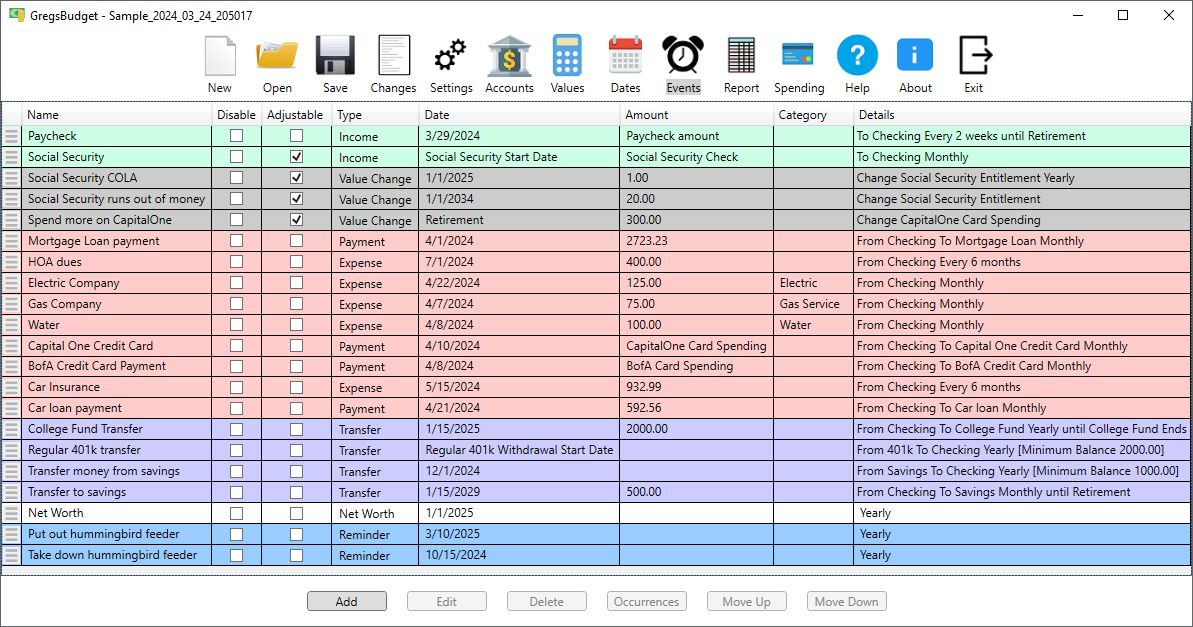
Events page
The events page shows the currently defined events. Events can be set for income, expenses, loan payments, transfers, value changes or reminders. Each event can also be a repeating event or just a single occurrence. These events are processed into individual instances for display on the report page. Adjustable events can be disabled or enabled directly on the report page in the adjustments window allowing you to instantly see the effects on your account balances.
Here are some of the other things you can do with the events:
- Add, edit or delete an event
- Specify the periodicity of any repeating event with extensive options like certain days of the month, days of the week or months of the year
- Specify the duration of any repeating events by date or number of instances
- Select a category to be assigned to the transaction when the event triggers
- Create "smart transfers" where the amount of the transafer is calculated based on account balance at the time of the transfer
- Convert currencies when transferring funds between accounts using different currencies
- Automatically set aside money for taxes if transferring from a tax deferred account
Here are some of the other things you can do with the transactions in the lower section:
- Add, edit, split, delete or reverse a transaction
- Search for transactions by description, date, amount, category and more with the "Search" button
- Export transactions to a CSV file using the "Export" button
Values Page
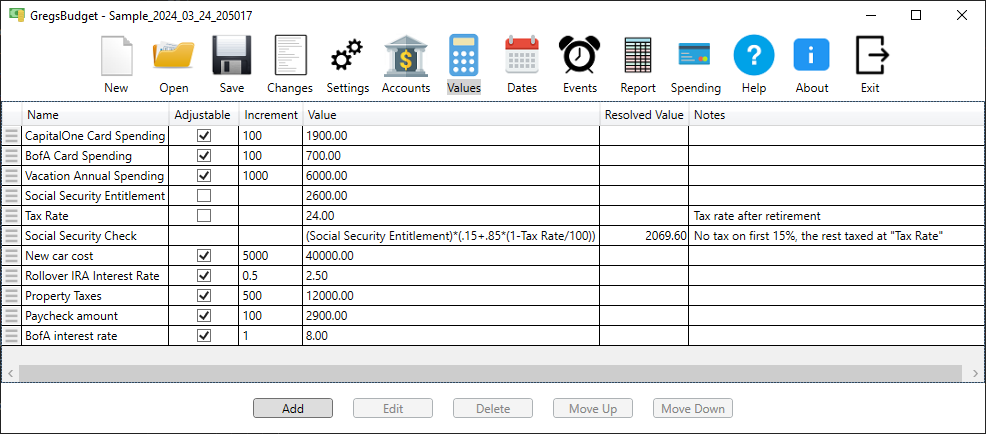
Values page
The values page shows the currently defined values and allows adding, editing, deleting or reordering the values. The "Resolved Value" column shows a calculated value for any values that use a formula or refer to another value. Adjustable values show up in the adjustments window on the right side of the report page.
Using values can give you insight into how changes affect your budget. For example, you can assign an adjustable value to the interest rate on your loan, savings or 401k to see how changing that rate affects your budget years later. Or use an adjustable value to see how changing the down payment on a new loan affects your budget.
Dates Page
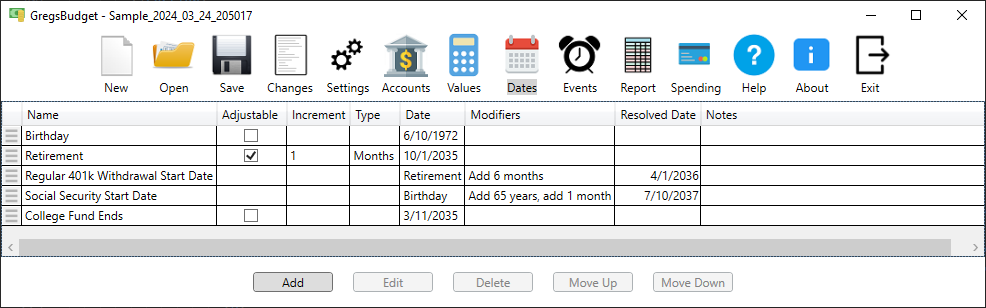
Dates page
The dates page shows the currently defined dates and allows adding, editing, deleting or reordering the dates. The dates are displayed in a grid with one row per date. The "Resolved Date" column shows a calculated date for any dates that use modifiers and/or reference other dates. Adjustable dates show up in the adjustments window on the right side of the report page and allow you to instantly see how changing a date affects your budget. Use adjustable dates when defining an event then go to the report page and open the adjustments window.
Like adjustable values, using adjustable dates can help you see how changes affect your budget. For example, you can assign an adjustable date to your retirement event and see how changing that date affects your retirement savings.
Spending Page
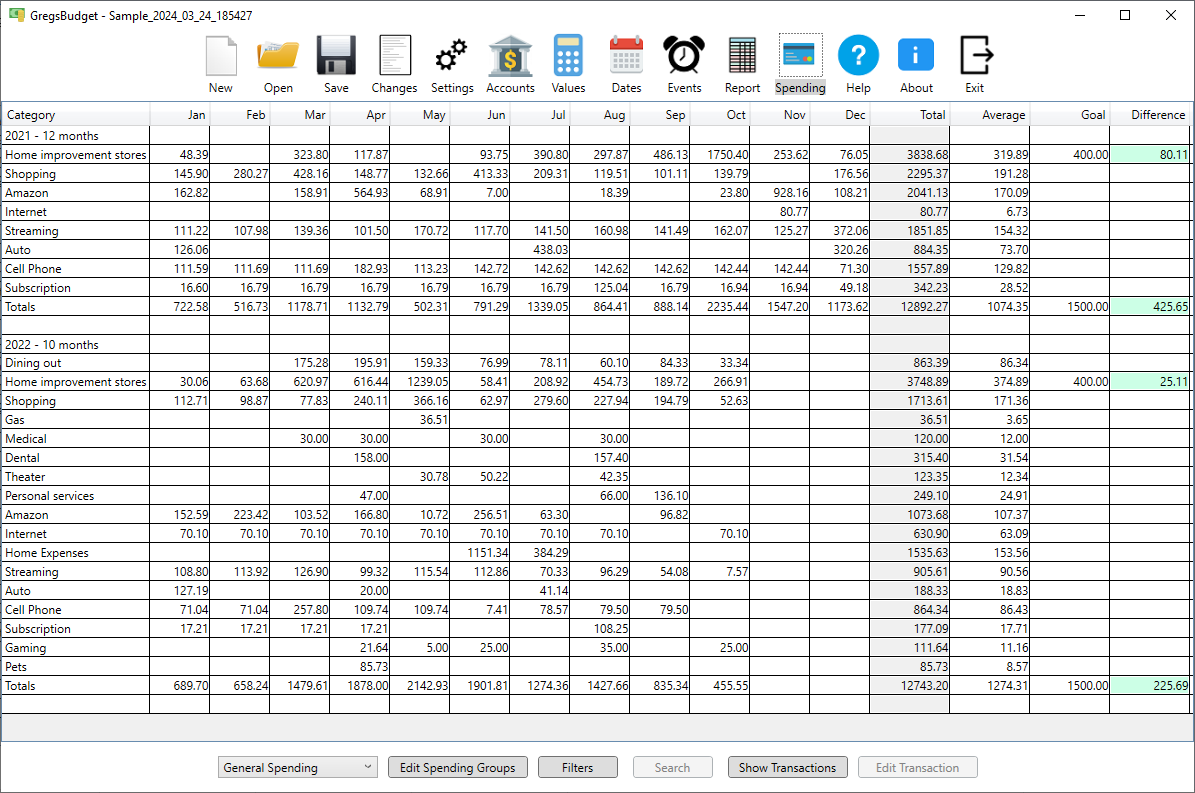
Spending page
The "Spending page" shows past monthly spending across selected accounts for selected categories. It does this by analyzing account transactions to show monthly spending in each category. Creating categories and assigning them to transactions is necessary for this analysis.
The results are displayed in a grid where each row is a category and the columns are the months. The grid is divided into groups where each group is a different year. On the right side of the group are columns with additional category stats. These include total for the year, monthly average, monthly spending goal (if defined for the category) and difference between average and goal. The last row in each group is a row for monthly totals across all the categories in that year. It also includes the total spending for the year, monthly average, monthly spending goal and difference columns. The monthly spending goal on the totals row is defined in the spending group.
Spending groups allow you to specify which categories are to be analyzed and optionally set a monthly spending goal for that group of categories. The "Edit Spending Groups" button allows you to add, edit, delete or reorder spending groups. Categories can individually have spending goals, but you can also create a spending group with any or all the categories and assign it a spending goal. The spending group is selected with the drop down list on the bottom left of the page. Only the categories in the selected spending group will be included in the calculations and shown on the "Spending page". If no spending groups have been created yet the "Spending page" includes all categories in the calculations.
Filters allow you to limit the range of the analysis by date and by account. The default is for both start and end date to be blank. Press the "Filters" button to bring up the window.
Another useful feature is the "Search" button. This button opens the "Search Transactions" window and displays the transactions from the currently selected category(ies). This window is useful to do quick searchs for date, amount or text in the transaction description.